Unsure where to start
You have data but no clear question, metrics, or direction.
Learn the foundations, build logical and polished dashboards, and develop a practical approach to business analysis.
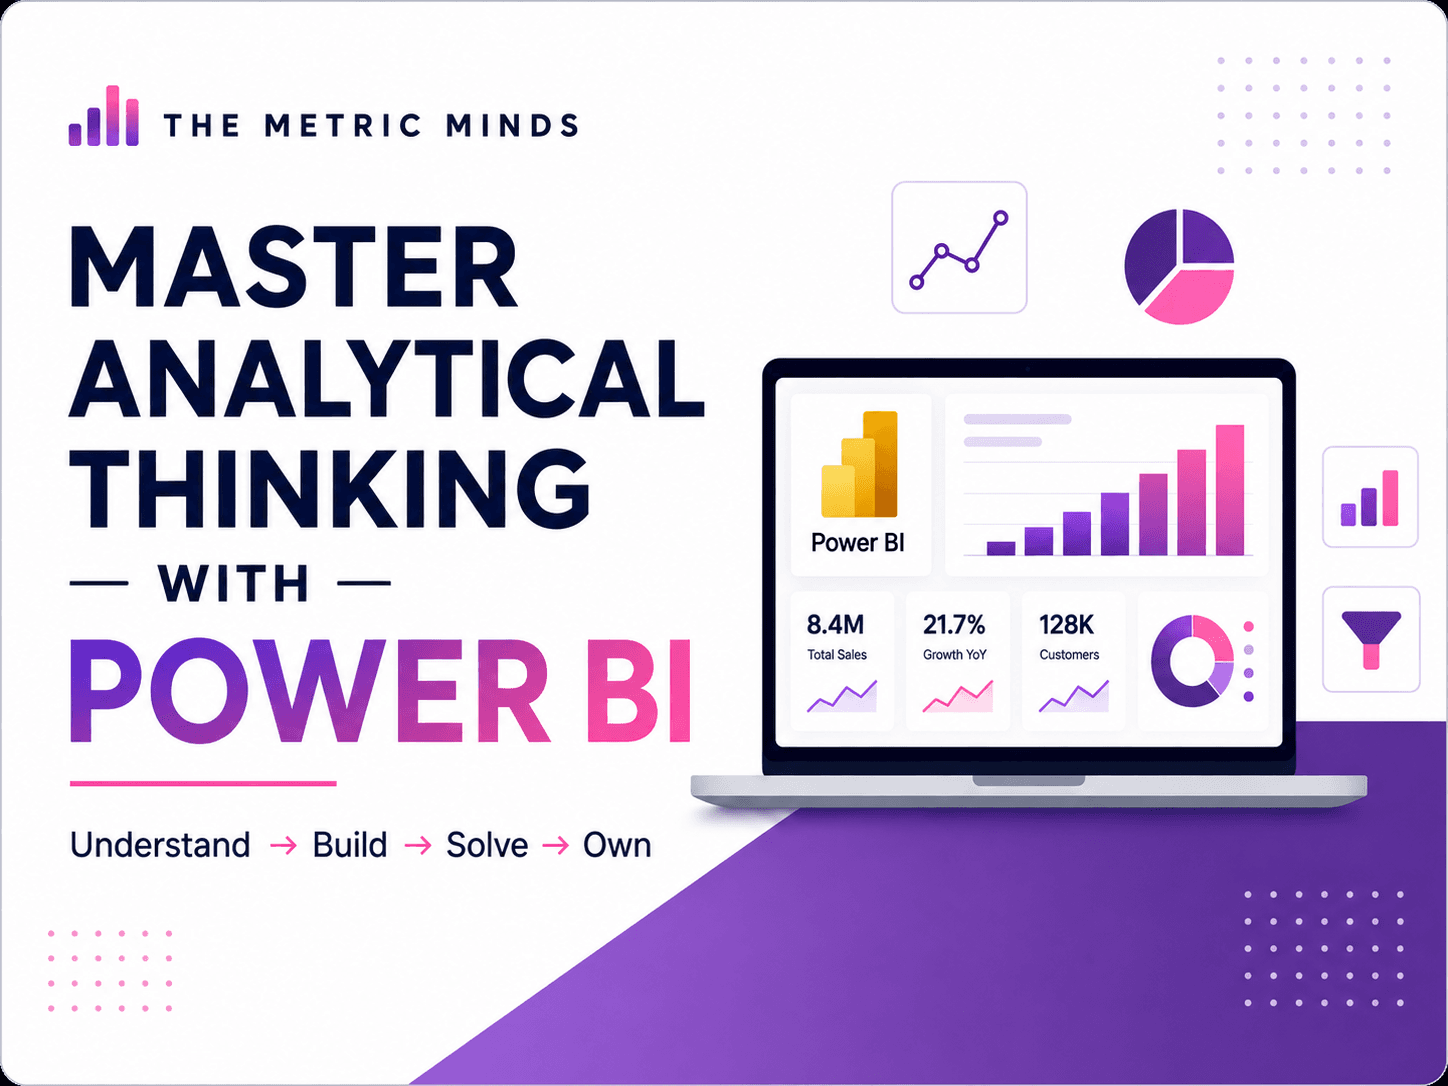
Knowing charts or DAX is not the same as being able to build a complete dashboard and solve a business request.
You have data but no clear question, metrics, or direction.
Individual actions make sense, but a complete dashboard still feels difficult.
You can spot changes but struggle to explain causes and recommendations.
The dashboard lacks analytical logic and portfolio-ready presentation.
It should help users understand what is happening and decide what to do next.
Metrics and analysis answer the right business question.
Layout, color, and interaction make information easy to find.
Insights are communicated clearly enough to support decisions.
Build Power BI skills alongside analytical thinking and product quality.
Learn modeling, DAX, visualization, and dashboard design.
Frame questions, select metrics, and develop recommendations.
Create practical dashboards with mentor feedback.
Build Power BI and Data Analyst foundations.
Improve independent dashboard and project work.
Analyze performance and support decisions more effectively.
Four connected stages, each producing a concrete output.
Understand Data
Learn business processes, sources, metrics, and essential statistics.
Build with Data
Cleaning, modeling, DAX, visual hierarchy, UI/UX, and interaction.
Solve with Data
Frame problems, test hypotheses, find insights, and recommend actions.
Own Your Analysis
Apply the full process and improve your project through feedback.
Follow an e-learning path and practice through each stage.
Get chat support and project feedback. This is a support period, not a course deadline.
CONTINUOUS LEARNING
The program evolves with real cases, dashboard trends, and Data Analyst skill needs.



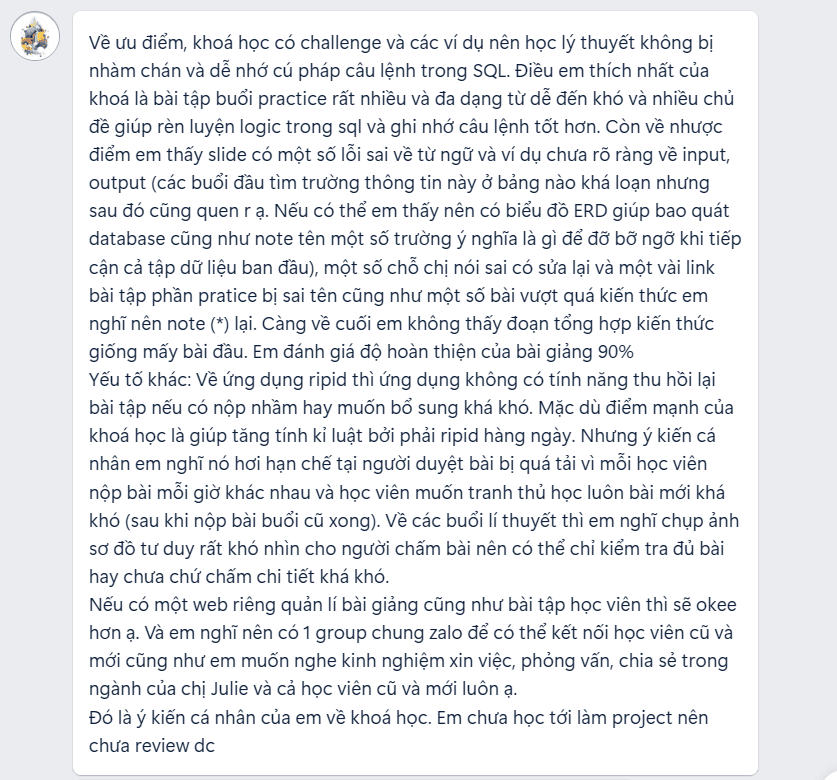
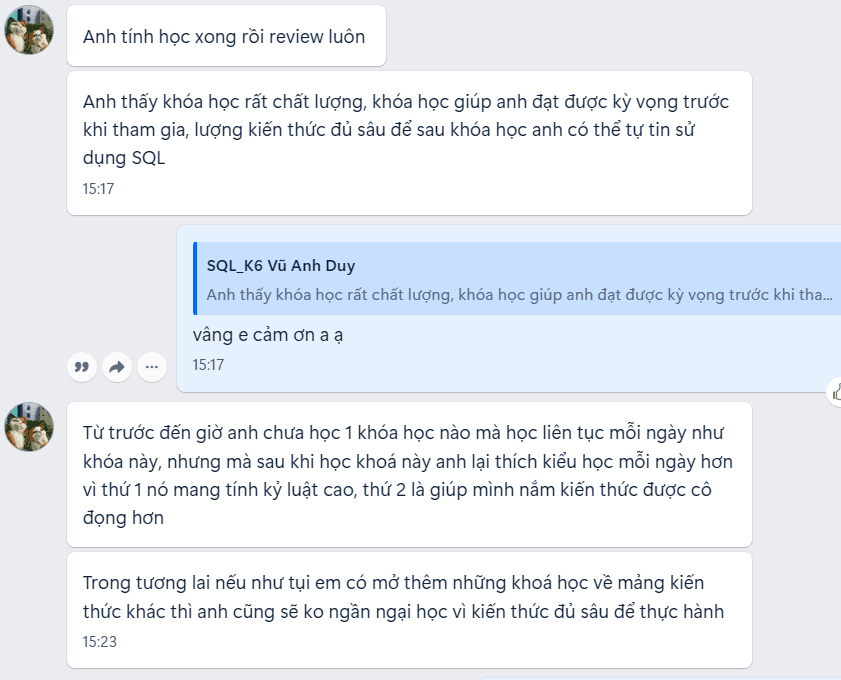
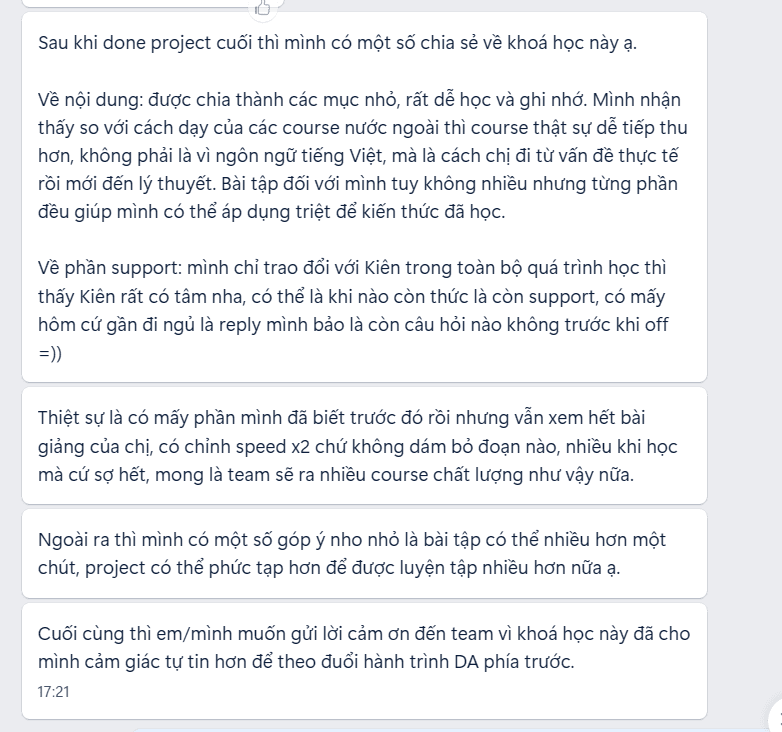















5 years of hands-on experience
Domains: Banking, Fintech, Retail at a major bank and a tech corporation.
400+ students & mentees
Supporting skill development, Data career growth, and participation in data competitions.
Business achievements at home and abroad
Won top awards as a student, applied analytical thinking and data storytelling to land her first DA job after 2 months of self-study.
Both plans include the full curriculum, projects, and future content updates.
Structured learning, practical analysis, and mentor feedback.
Bao gồm:
Full program and Capstone
Dashboard & Business Analysis
30 days of chat support
Project and portfolio feedback
4 months of Data Lab Pro
Monthly content updates
Direct mentor sessions focused on dashboards and personal projects.
Bao gồm:
All Mentorship benefits
Four 1:1 sessions
Dashboard & project review
Analytical thinking support
4 months of Data Lab Pro
Monthly content updates
Assess your foundation and priorities.
Clarify the problem, metrics, and analytical logic.
Improve analysis, UI/UX, and portfolio presentation.
Review progress and build a practice plan.
Not the right fit? Request a refund within the first 7 days.
You have seven days to experience the program. If it is not right for you, you can request a tuition refund.
100% tuition refund
No additional fees
No assignment requirement
Simple confirmation process
Yes. The program starts with the foundations and progresses to dashboards, business analysis, and projects.
No. SQL is useful but is not an entry requirement.
Yes. You learn the DAX needed to build dashboards and perform analysis.
No. Thirty days is the mentor support period, not the course deadline.
The program is updated monthly with dashboard breakdowns, practice cases, UI/UX guidance, or additional techniques.
Yes. You retain access to content and updates according to your plan benefits.
Plus includes four 1:1 sessions for direct discussion and deeper dashboard or project review.
Develop Power BI skills, analytical thinking, and projects that demonstrate your capability.